Track Analysis
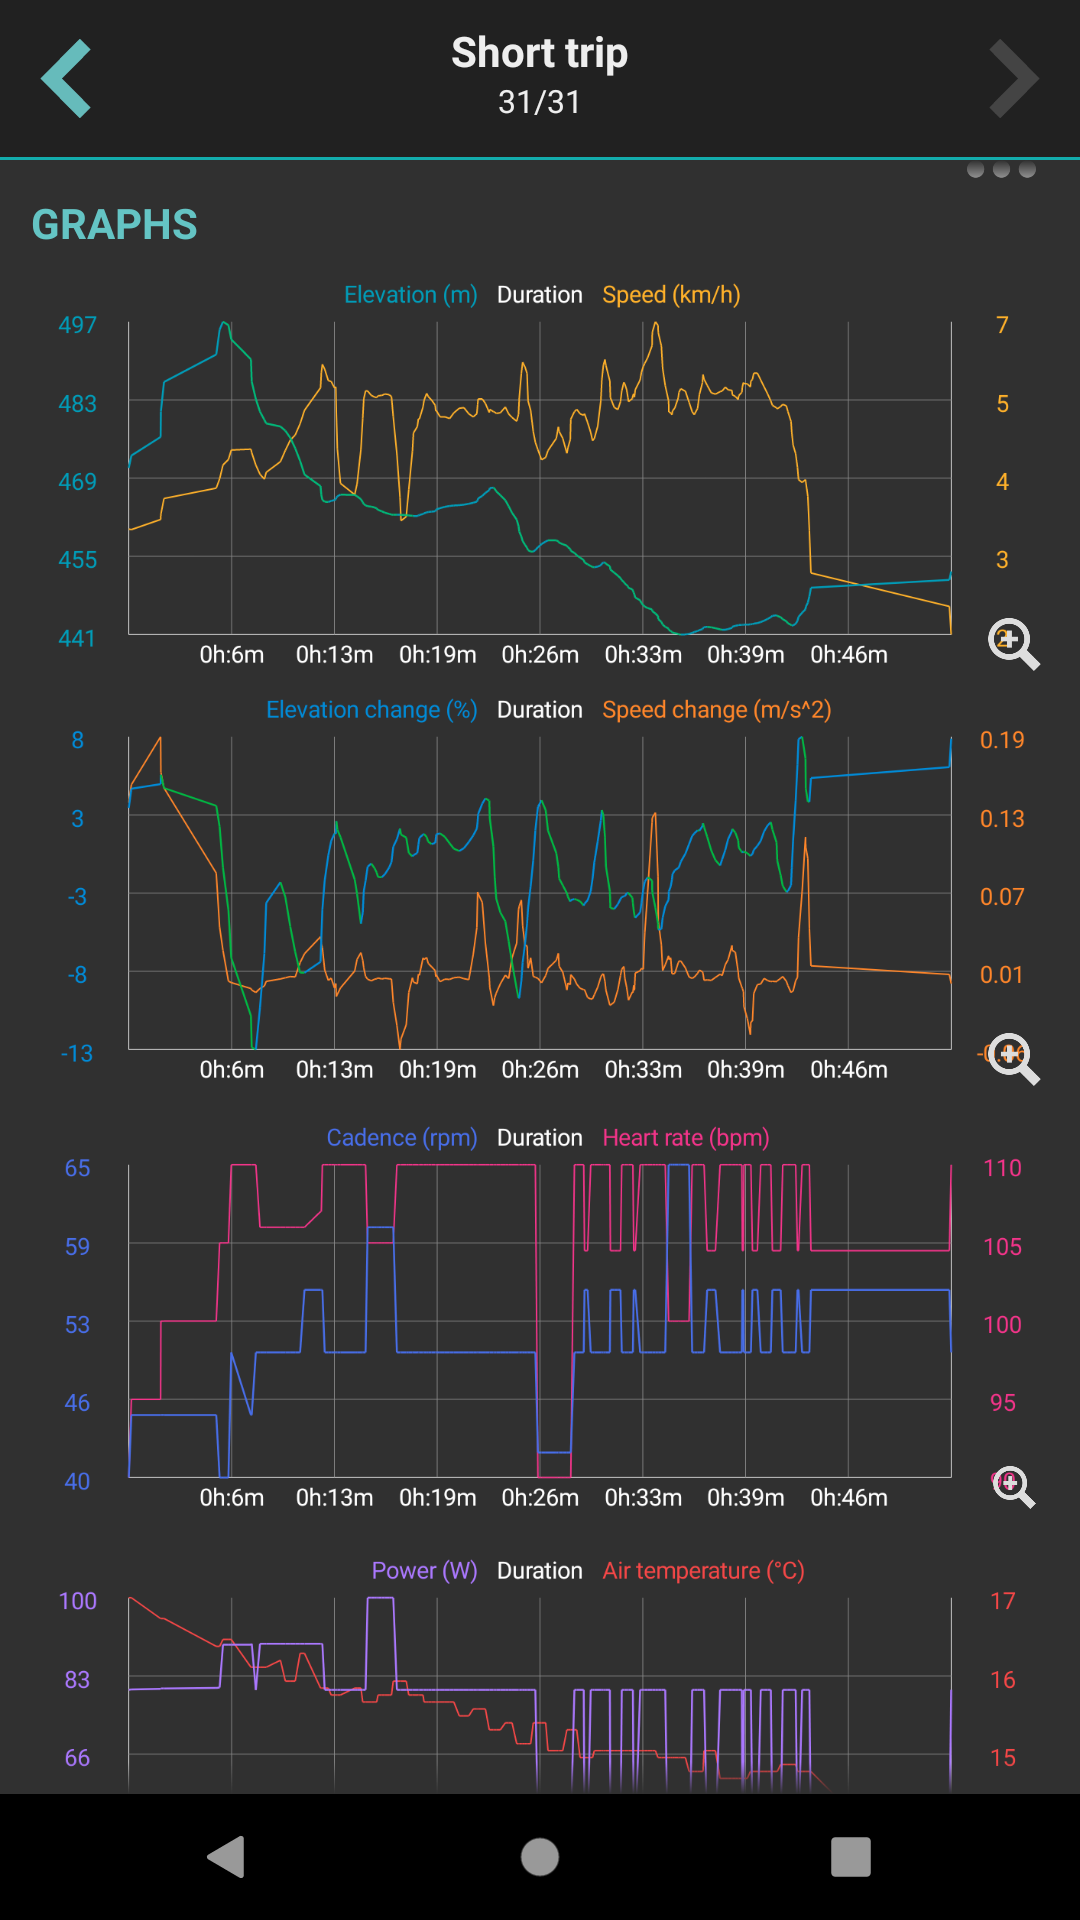
Graphs
Underneath the statistics section graphs are displayed in case the track is containing elevation data. The number of graphs displayed can be between 0 to 4, depending on the number of recorded data
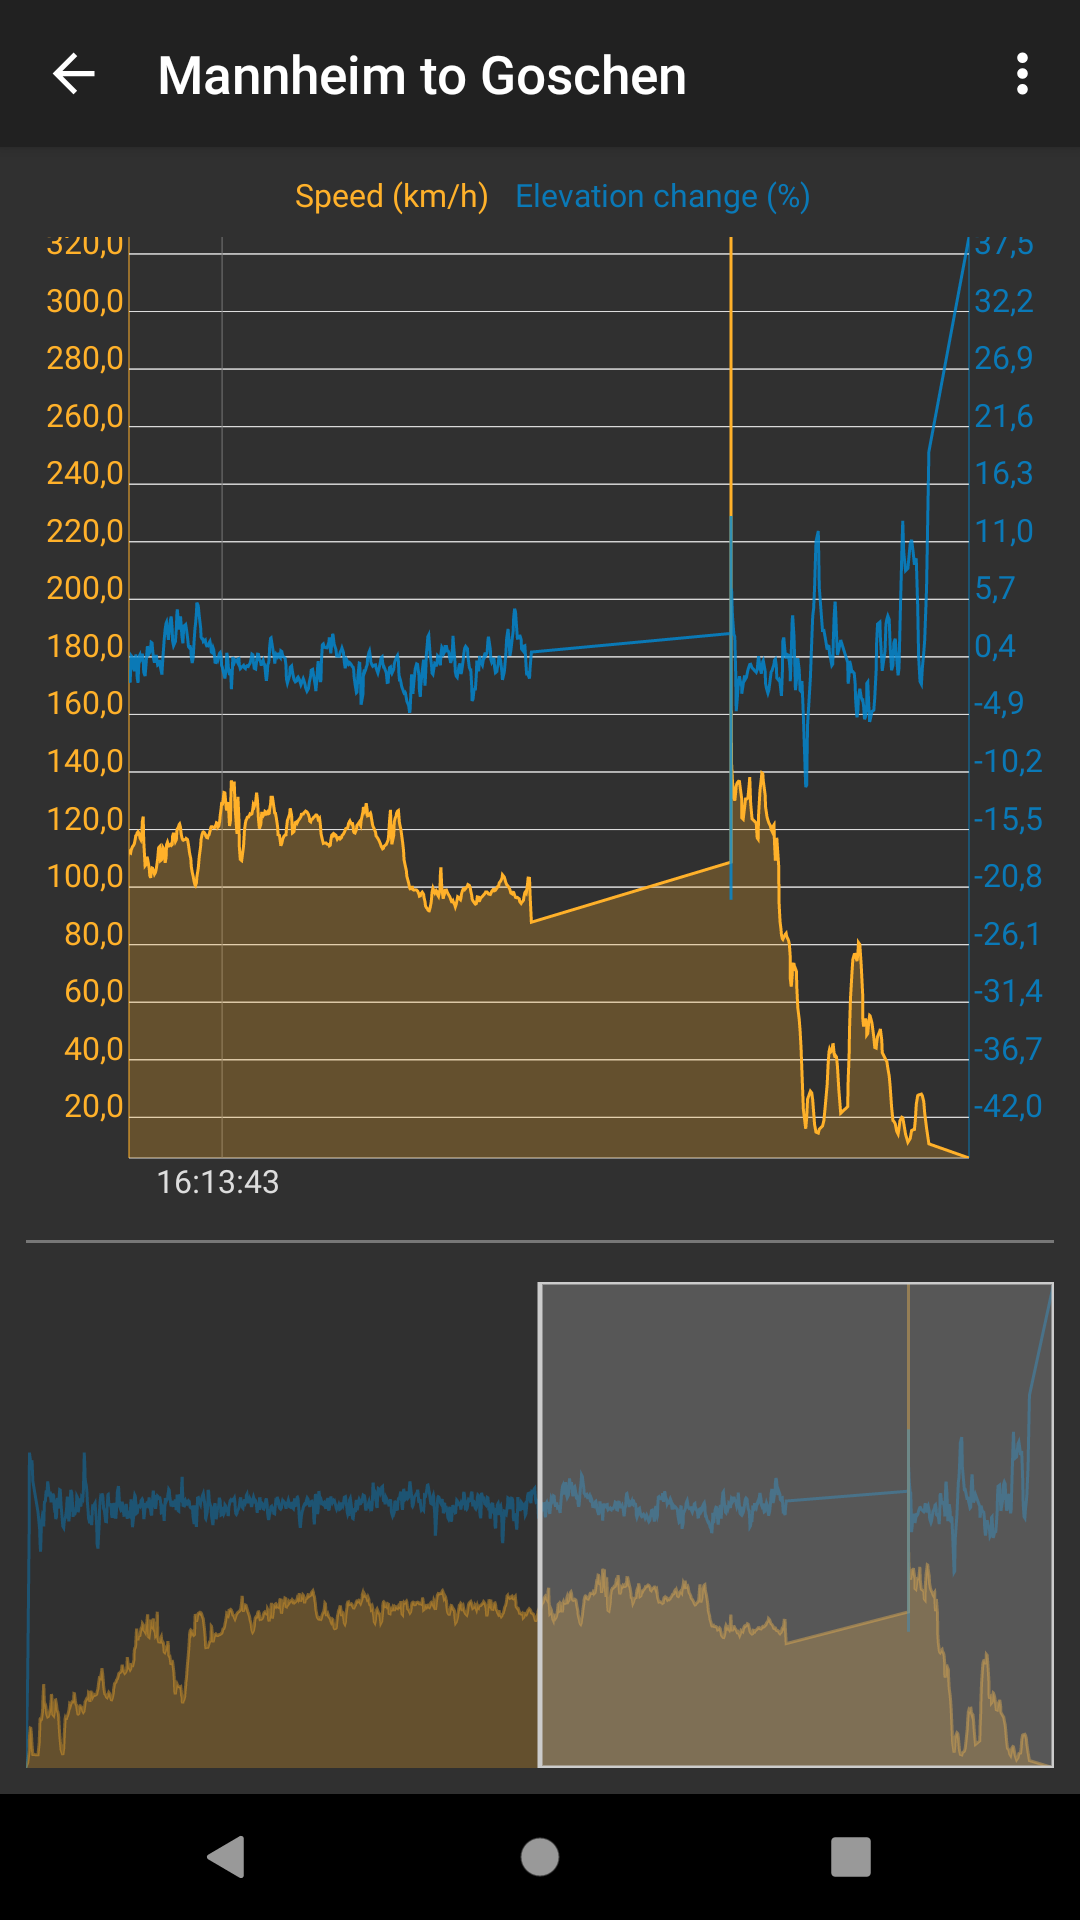 After clicking on the graphs, their detail is being shown. In the lower part of the screen preview of the whole track is visible and in the main part, the detail of the graph is displayed. Three dots next to the track name contain settings for tracks:
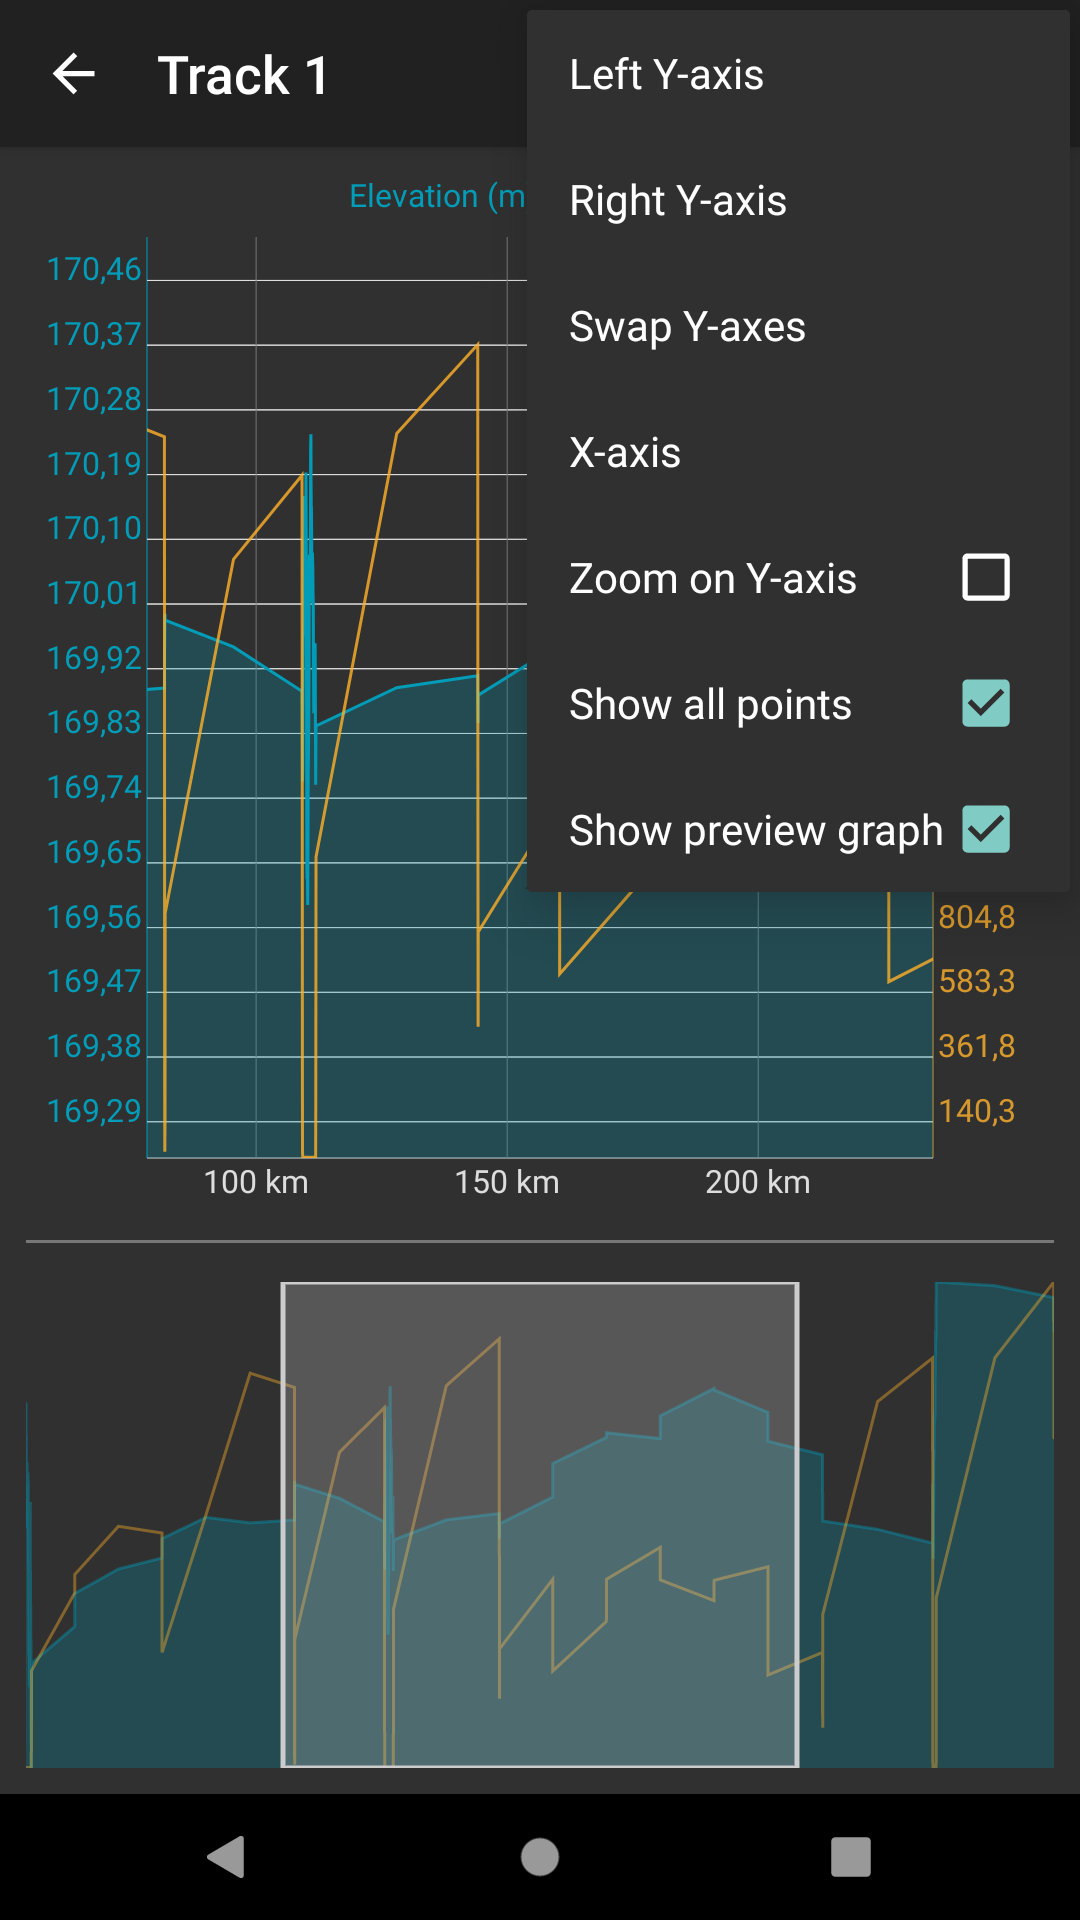
- Left Y-axis - allows choosing which metrics should be displayed on the left Y-axis. The options are Elevation, Speed (in case the track contains this info), Elevation change, Speed change, Cadence, Heart rate, Power, Air temperature none.
- Right Y-axis- allows choosing which metrics should be displayed on the right Y-axis. The options are the same as for the left Y-axis.
- Swap Y-axes - switches the Y-axes.
- X-axis - selection of data displayed on X-axis - distance, duration, time.
- Zoom on Y-axis - allows to enlarge any part from the graph.
- Show all points - shows all of the points in the graph, not only 500 that are set by default. Useful mainly with the tracks with higher volume.
- Show preview graph - shows full graph preview in the lower part of the screen.
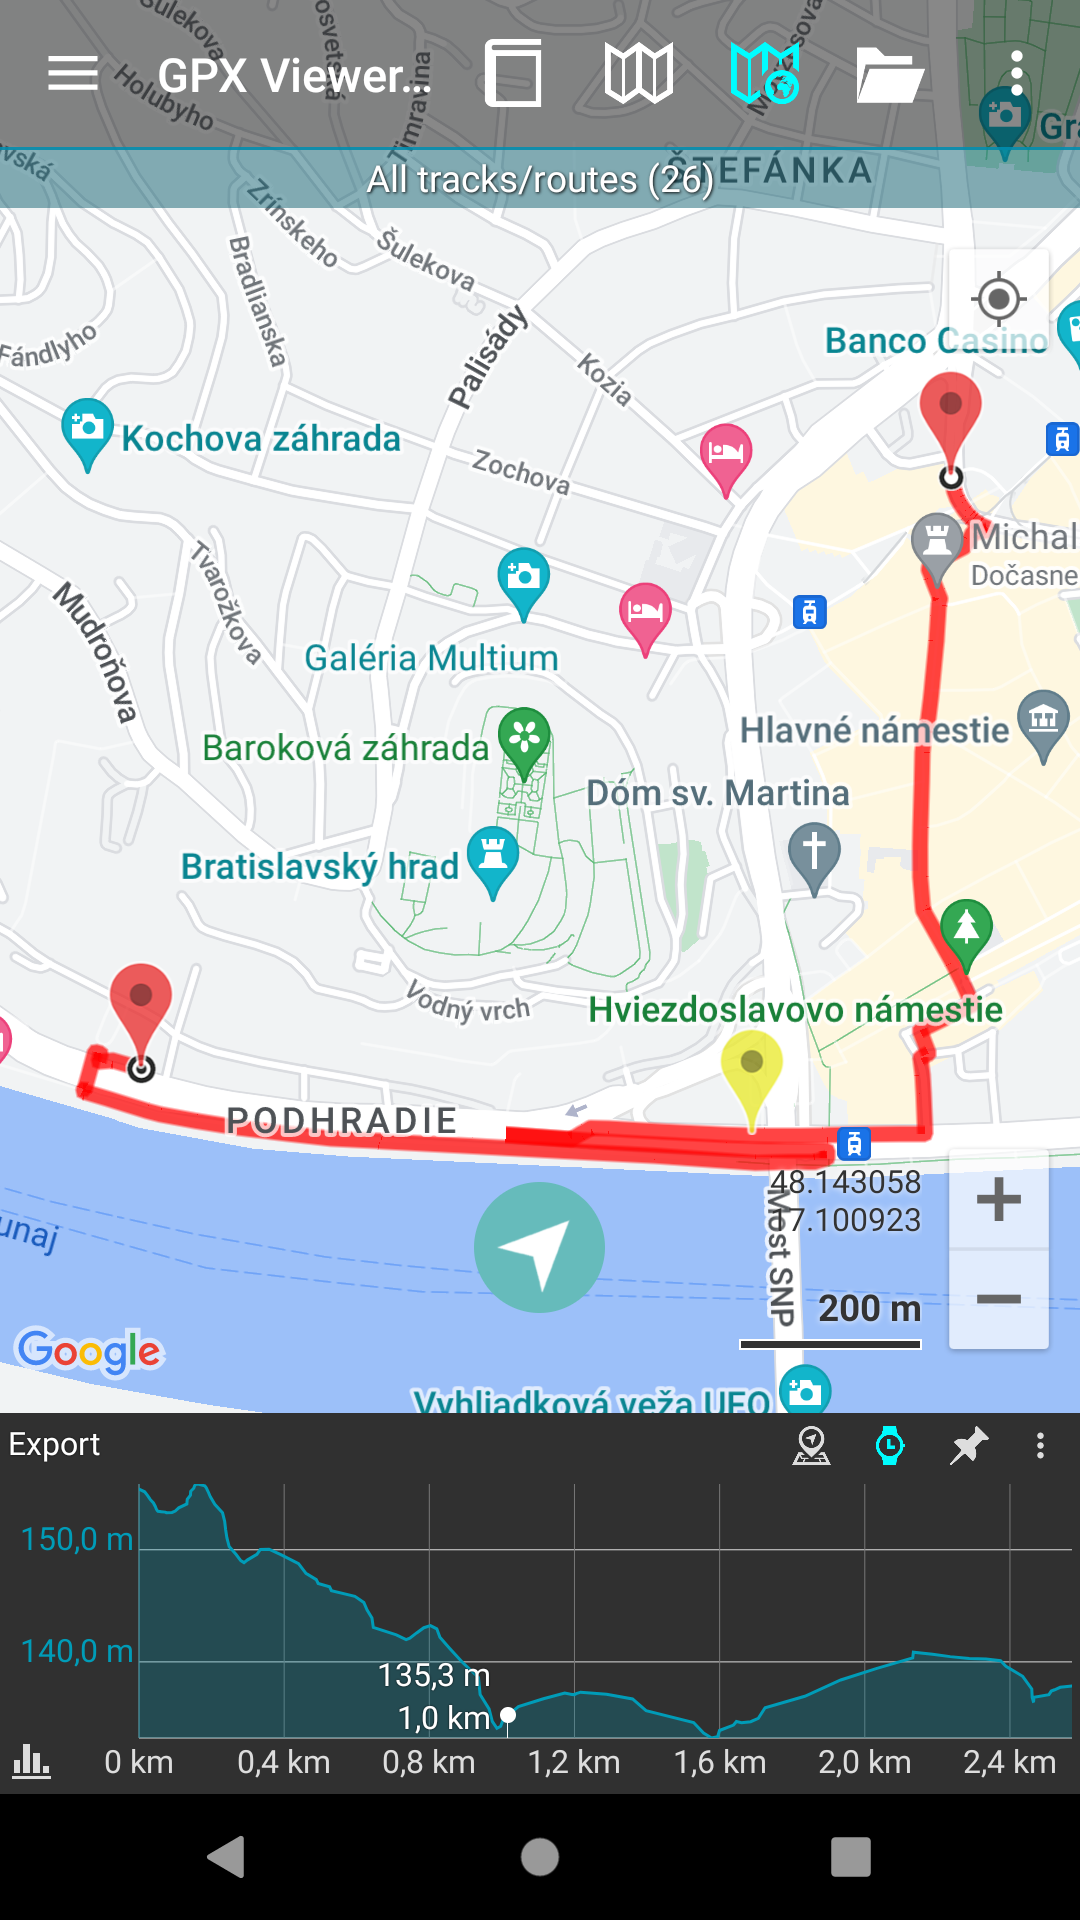
Another form of displaying graphs is within the map view after clicking on a specific track/route. How to show the graph below map can be found here. These graphs display the details of the track displayed on the screen. Above the graph from the left side, there is:
- Name of the track.
- Icon to display details and statistics of the track.
- Selection of data that can be displayed on the X-axis.
- Option to pin the graph to the screen
- Option to customize the graph.
The options to customize the graph are:
- Show distance icons - displays the distance from the start in km/miles depending on the selected metrics. After clicking on the distance icon users see the time since the beginning of the track, that this distance was done and also the local time and the date when the user reached this point.
- Show direction icons - shows in which direction was the track recorded.
- Zoom graph - after checking allows to zoom into the graph.

Underneath the graph on the left side, there is an icon that allows choosing which data should be displayed on the Y axis.
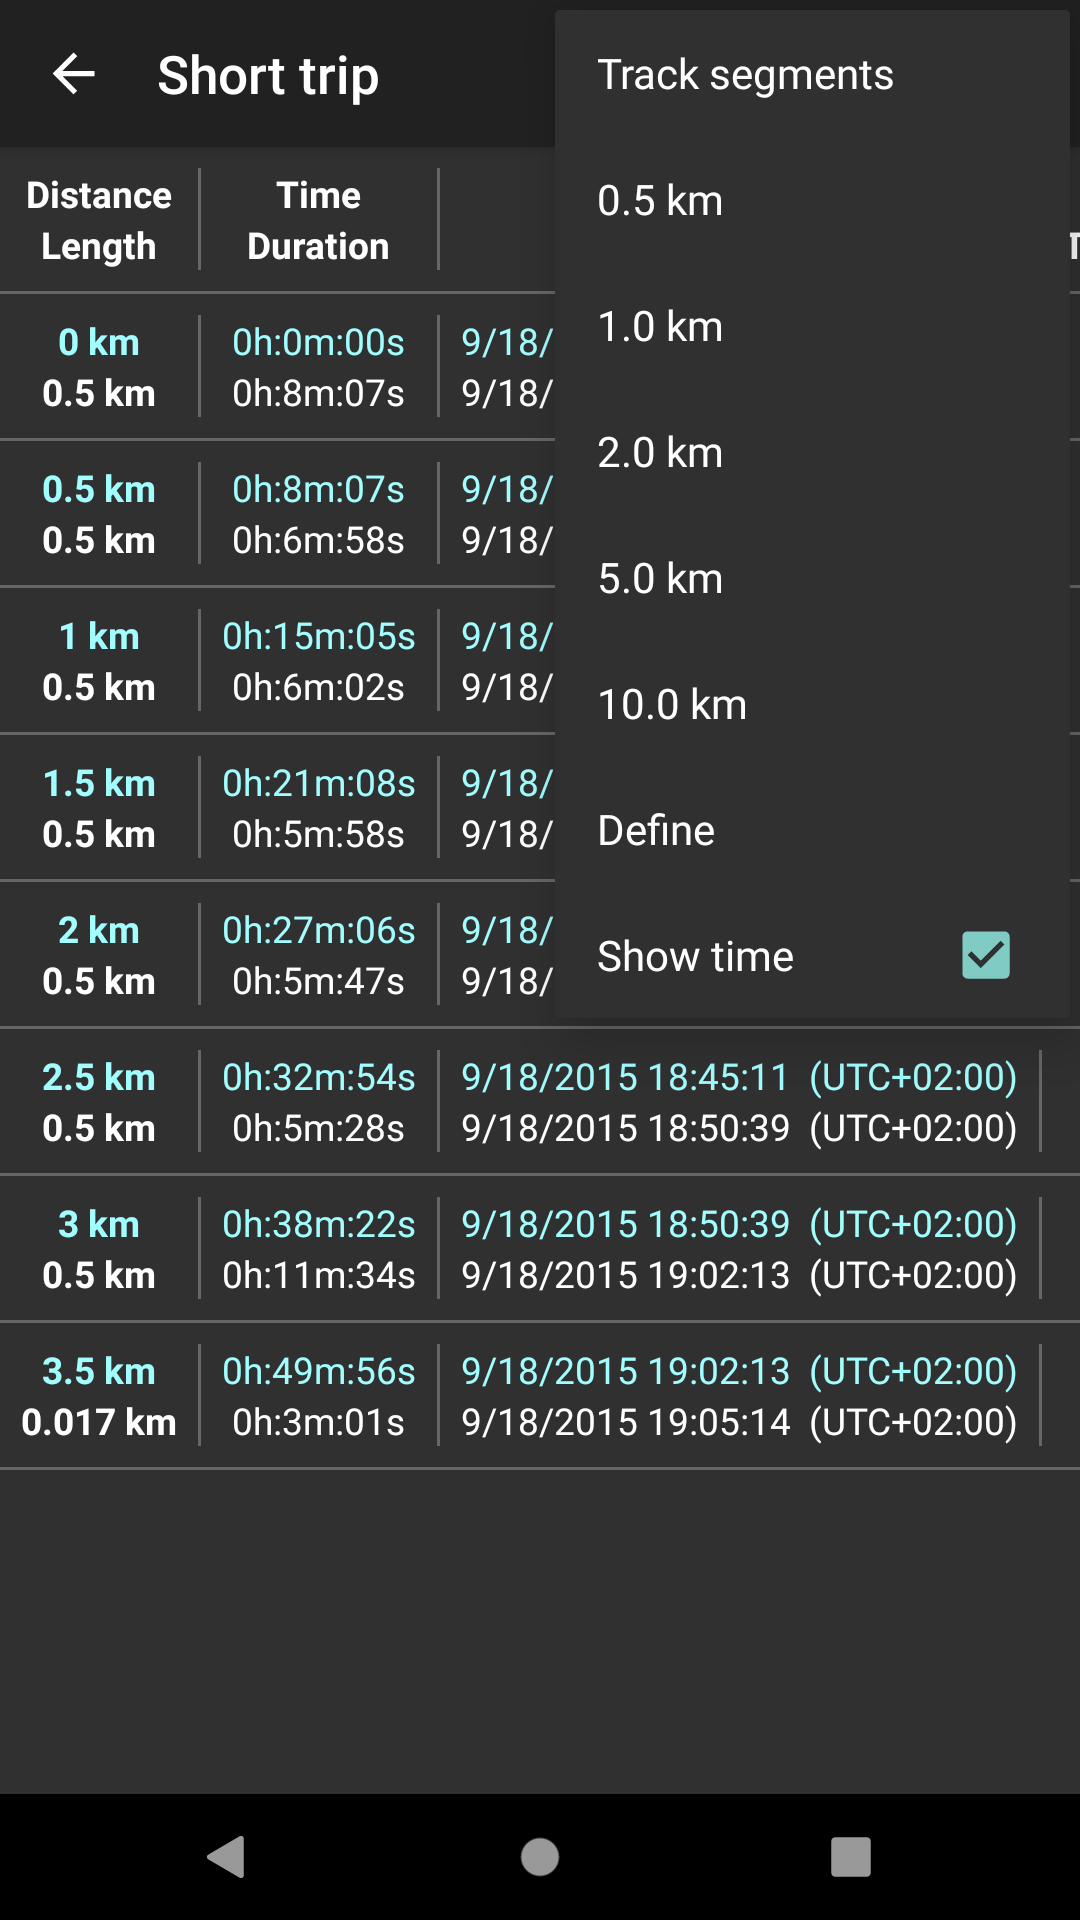
Segments
The segments are finalized parts of the track. The segments are described with:
- Distance and Length
- Time and Duration
- Start and End time of the segment (Shown only after turning on show time in the menu)
- Total climb and total descent
- Average speed and Maximum speed
- Average cadence and Maximum cadence
- Average heart rate and Maximum heart rate
- Average power and Maximum power
- Average temperature and Maximum temperature

On the top of segmentation after clicking on the three dots next to the description users can choose whether they want segmentation based on the track segments or based on the specific lengths.
Track segments are created after every finalized part of the track (in GPX viewer pro it can happen after pausing the recording). Specific lengths can be chosen from the menu or entered manually.