Track information
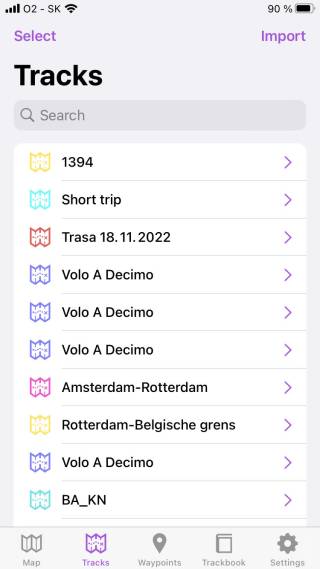
The track tab screen shows imported or recorded tracks. You can also find information about importing tracks on this page this page.
To show track details, tap on the track in the list. Track details contains this information:
- Color - the color of the track line in hexacode, or also with possibility to choose from palette
- Name - name of the track
- Description - more detailed information about the track
Statistics about the track:
- Length - track length
- Flat length - a distance of the track that was done on a flat surface
- Climb length - a distance of the track that was done on an uphill surface
- Descent length - a distance of the track that was done on a downhill surface
- Elevation difference - difference in elevation
- Elevation gain - how many elevation meters were climbed
- Elevation loss - how many elevation meters were descended
- Elevation min - lowest elevation on the track
- Elevation max - highest elevation of the track
- Start time - time when recording started
- End time - time when recording ended
- Duration - time length of the track
- Pace - throughout the track recording
- Speed max - maximum speed on the track (displayed only if the information of track duration and length are available)
- Average speed - an average speed of the track (displayed only if the information of track duration and length are available)
- Cadence max - maximum cadence on the track (only displayed in case the track is recorded with the device that measures cadence)
- Average cadence - an average cadence of the track (only displayed in case the track is recorded with the device that measures cadence)
- Heart rate max - maximum heart rate recorded on the track (only displayed in case the track is recorded with the device that measures also physiological functions)
- Average heart rate - an average cadence of the track (only displayed in case the track is recorded with the device that measures also physiological functions)
- Power max - maximum power through the track recording (only displayed in case the track is recorded with the device that measures also power)
- Average power - average power through the track recording (only displayed in case the track is recorded with the device that measures also power)
- Temperature max - maximum temperature of the environment through the track recording (only displayed in case the track is recorded with the device that measures also temperature)
- Average temperature - the average temperature of the environment through the track recording (only displayed in case the track is recorded with the device that measures also temperature)
The charts can display the following information:
- Elevation per distance (this graph contains an elevation check button which replaces the recorded data with data from the internet, which is very useful when the track is recorded with an unstable GPS signal)
- Speed per distance
- Cadence per distance
- Heart rate per distance
- Power per distance
- Temperature per distance
Lastly, some additional information is shown:
- Comment - can contain any information from the person that recorded or created the track
- Source - what kind of device are they coming from
- Type - of the track/route
- Number - of the track/route
The eye on the top of the screen disables or enables the appearance of the track on the map tab. Sharing button allows you exporting of the track. More information about exporting can be found on this page.

